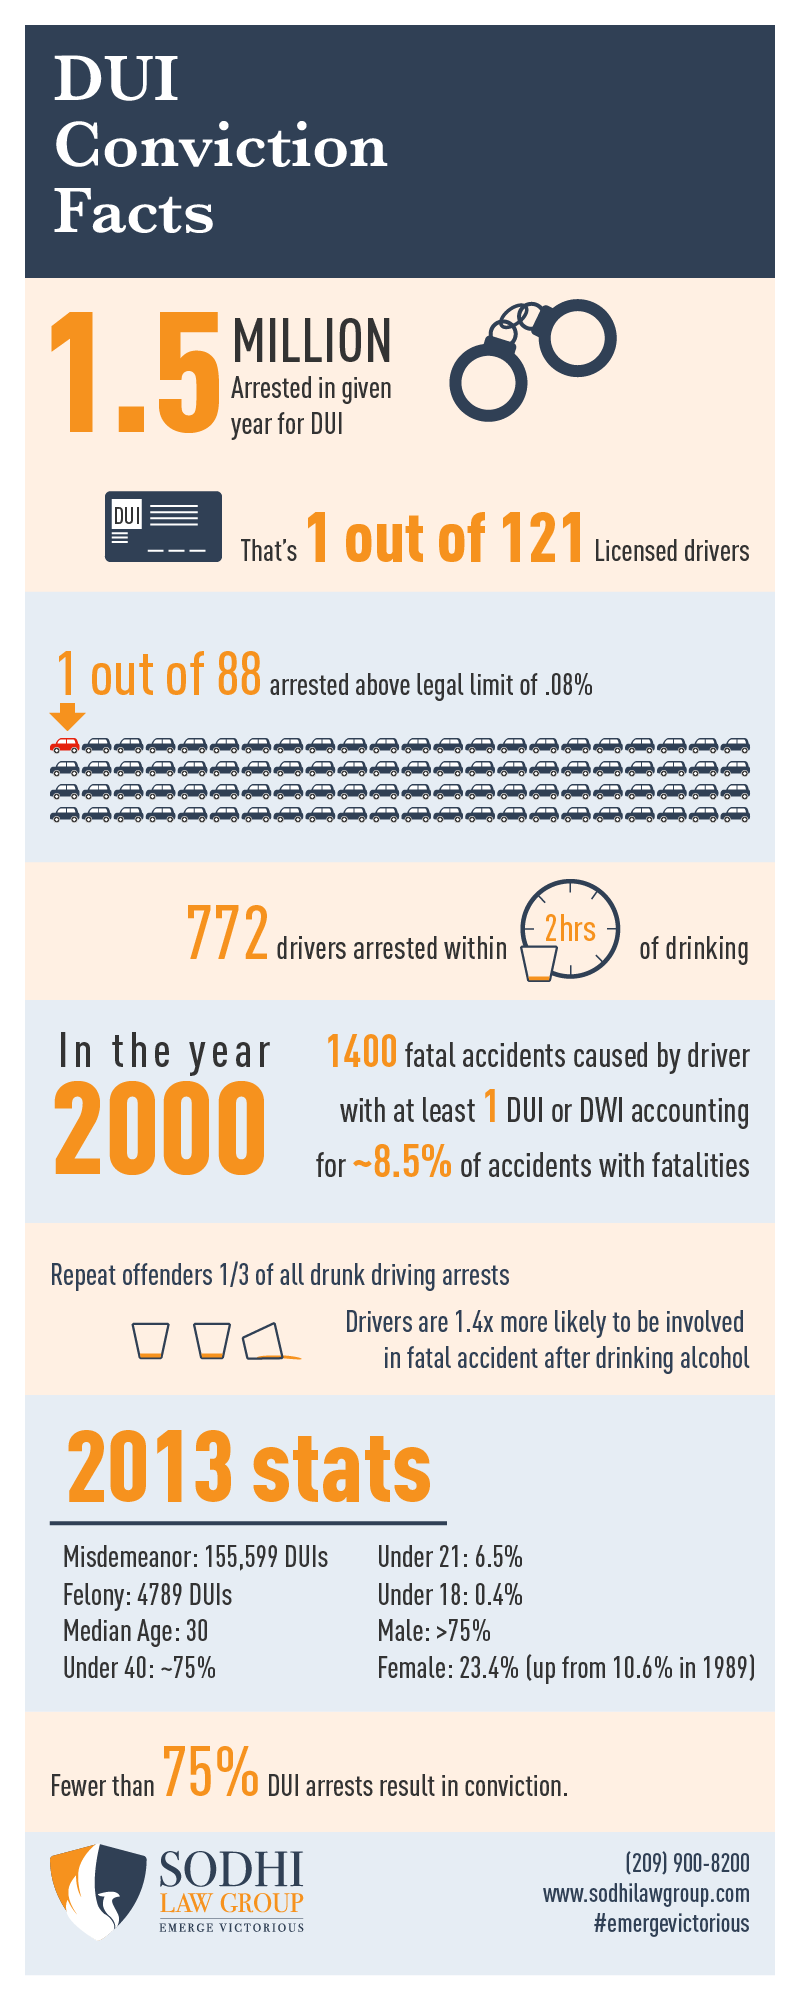
A DUI is one of the most painful punishments out there. There are a variety of fees, fines, and jail time that we decided to break down in this DUI infographic! This infographic shows the numbers behind DUI’s over the years, and who commits DUI’s.
DUI’s are taken very seriously because they can do harm to the community. The likeliness of being in an accident increases when a driver is under the influence. DUI accidents also account for a large percent of accidents in California.
DUI charges can be increased if an accident occurred and hurt someone or did any damage. They can also be increased if the drinker is under age, has a suspended license, doesn’t have a license, or has already been convicted of a DUI in the past. It is also stated that out of 800 DUI charges, 772 of those drivers had been drinking in the past two hours.
When you are in a situation where you have been drinking, make sure to balance your drinking with food and water, and always get a ride home from someone who has not been drinking. You do not want to be a part of these statistics.
Check it out to see how serious a DUI conviction could be and why you should take every precaution to avoid a DUI. All the data is cited in the infographic if you would prefer to do your own investigating. Take a look and let us know what you think! If you have been charged with a DUI or have any questions, give us a call (209) 900-8200. Drink responsibly.


